全方位斜率(上):掌握跨時間跨市場的趨勢洞察
[免責聲明] 本文僅供教育和資訊目的,不構成投資建議。讀者在做出任何投資決定前應諮詢合格的金融專業人士。
在量化交易領域深耕多年,我發現市場趨勢猶如一條奔騰的河流,有主流,也有支流。要全面掌握市場動態,單一時間框架或單一市場的分析往往不夠。今天,讓我們一起探討如何透過多維度斜率分析,在不同時間尺度和市場之間尋找趨勢的共鳴。
① 時間框架的本質:從分鐘到月度的斜率差異
作為一個長期從事量化交易研究的分析師,我常常被問到:"為什麼同一隻股票,在不同時間框架下的趨勢看起來如此不同?"這個問題引出了我們今天要深入探討的第一個主題:時間框架的本質。
在前兩篇文章中,我們詳細討論了斜率的基本概念和高階計算方法。今天,我們要將這些知識應用到更廣闊的視野中。不同時間框架下的斜率差異,實際上反映了市場參與者在不同時間尺度上的行為特徵。
讓我們透過一個具體的例子來理解這一點:
import pandas as pd
import numpy as np
import matplotlib.pyplot as plt

def calculate_slopes_multiple_timeframes(price_data, timeframes=['1H', '4H', '1D']):
    """
    計算不同時間框架下的斜率

    參數:
    price_data: 原始價格資料(假設為分鐘等級)
    timeframes: 需要計算的時間框架列表
    """
    results = {}

    for tf in timeframes:
        # 重採樣數據
        resampled = price_data.resample(tf).agg({
            'open': 'first',
            'high': 'max',
            'low': 'min',
            'close': 'last'
        })

        # 計算斜率(使用20個週期的視窗)
        slopes = pd.Series(index=resampled.index)
        window = 20

        for i in range(window, len(resampled)):
            y = resampled['close'].iloc[i-window:i]
            x = np.arange(window)
            slope, _ = np.polyfit(x, y, 1)
            slopes.iloc[i] = slope

        results[tf] = slopes

    return results
這個函數幫助我們理解同一市場在不同時間框架下的斜率特徵。有趣的是,我們常發現:
- 短期時間框架(如分鐘等級)的斜率波動更加劇烈,反映了市場的短期噪音。
- 中期時間架構(如小時等級)的斜率更能反映當前的主導趨勢。
- 長期時間框架(如日線、週線)的斜率則顯示了市場的基本面走勢。
然而,這些不同時間框架的斜率並非孤立存在。正如河流中的支流最終匯入主流,不同時間框架的趨勢也存在著內在的連結。在下一節中,我們將探討如何協調和整合這些不同時間尺度的資訊。
② 多時間框架斜率分析法
在了解不同時間框架的特性後,關鍵問題是如何有效地整合這些資訊。這就像觀察一幅畫,我們既需要看到整體構圖(長期趨勢),也要注意局部細節(短期波動)。
2.1 時間框架協調:確保資料一致性
首先,讓我們看看如何確保不同時間框架資料的一致性:
def align_timeframe_data(hourly_data, timeframes=['1h', '4h', '1d']):
    """
    協調不同時間框架的數據,以小時數據為基礎

    參數:
    hourly_data: 小時級基礎資料('1H')
    timeframes: 需要分析的更大時間框架列表

    返回:
    DataFrame: 包含所有時間框架斜率的對齊數據
    """
    aligned_slopes = {}


    # 計算較大時間框架的斜率
    for tf in timeframes:
        # 重採樣數據
        resampled = hourly_data.resample(tf).agg({
            'close': 'last',
            'volume': 'sum'
        }).dropna()

        # 計算標準化斜率
        slopes = calculate_normalized_slope(resampled['close'], window=20)

        # 將斜率資料對齊到小時框架
        if tf == '1h':
        	aligned_slopes[tf] = slopes
        else:
        	# 將斜率資料對齊到小時框架
            aligned_slopes[tf] = slopes.reindex(aligned_slopes['1h'].index, method='ffill')

    return pd.DataFrame(aligned_slopes)


def calculate_normalized_slope(prices, window=20):
    """
    計算標準化斜率
    """
    slopes = pd.Series(index=prices.index)
    price_std = prices.rolling(window).std()

    for i in range(window, len(prices)):
        y = prices.iloc[i-window:i]
        x = np.arange(window)
        slope, _ = np.polyfit(x, y, 1)
        # 使用標準差標準化斜率
        slopes.iloc[i] = slope / price_std.iloc[i] if price_std.iloc[i] != 0 else 0

    return slopes


# 使用範例
# 取得對齊的斜率數據
aligned_slopes = align_timeframe_data(hourly_data)

print(f"數據形狀: {aligned_slopes.shape}")
print("\n每個時間框架的非空值數量:")
print(aligned_slopes.count())

# 顯示5月份對齊的斜率數據
monthly_mask = (aligned_slopes.index.year == 2024) & (aligned_slopes.index.month == 5)
aligned_slopes[monthly_mask].plot()
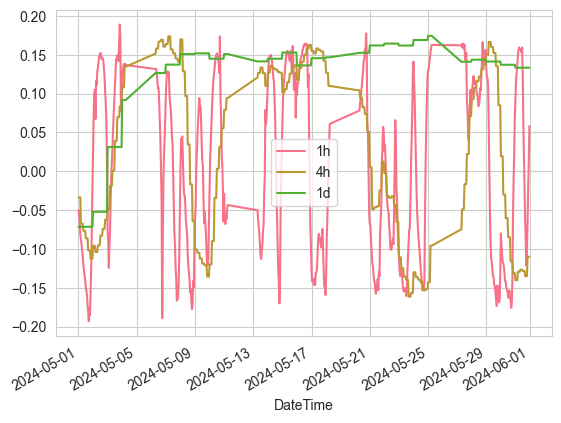
這個方法的關鍵在於:
- 使用標準化處理,使不同時間框架的斜率具有可比性
- 透過重採樣和資料對齊,確保不同時間框架的資料在時間上同步
- 考慮了成交量信息,增加分析維度
2.2 斜率疊加技術:綜合不同時間尺度的趨勢
現在,讓我們看看如何將不同時間框架的斜率資訊整合起來:
def composite_slope_indicator(aligned_slopes, weights={'1h': 0.3, '4h': 0.3, '1d': 0.4}):
    """
    建立綜合斜率指標

    參數:
    aligned_slopes: 對齊後的各時間框架斜率數據
    weights: 各時間框架的權重
    """
    composite = pd.Series(0, index=aligned_slopes.index)

    for tf, weight in weights.items():
        composite += aligned_slopes[tf] * weight

    return composite


# 取得組合的斜率數據
composite_slope = composite_slope_indicator(aligned_slopes)

# 顯示5月份的組合斜率數據
composite_slope[monthly_mask].plot()
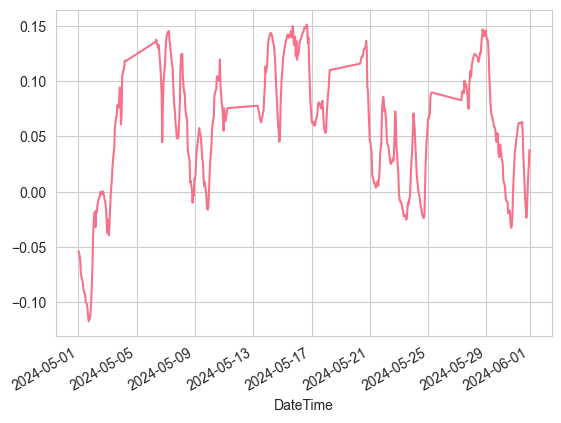
这个综合指标有几个显著特点:
- 权重可调:可以根据交易策略调整不同时间框架的权重
- 信号确认:多个时间框架的趋势一致时,信号更可靠
- 冲突识别:当不同时间框架的趋势出现分歧时,提供预警
在实践中,我发现这种多时间框架的分析方法能够帮助我们:
- 更好地识别主导趋势
- 找到更合适的入场点
- 降低假信号的影响
但需要注意的是,随着分析维度的增加,我们也面临着更复杂的信号解释问题。这个挑战将在本文后面的部分详细讨论。值得一提的是,在下一篇文章中,我们将探讨如何将这些分析转化为具体的交易策略。
③ 跨市场斜率相关性
在金融市场中,不同市场之间的联系就像是一张无形的网。作为一个资深量化分析师,我发现斜率分析在揭示这些市场关联性方面有着独特的优势。
3.1 外汇对与商品的斜率关系
让我们先来看一个经典的例子 - EUR/USD与黄金价格的关系:
def analyze_cross_market_slopes(market1_data, market2_data, window=30):
    """
    分析兩個市場之間的斜率相關性

    參數:
    market1_data, market2_data: 兩個市場的價格數據
    window: 計算斜率和相關性的視窗大小
    """
    # 計算兩個市場的標準化斜率
    slopes1 = calculate_normalized_slope(market1_data, window)
    slopes2 = calculate_normalized_slope(market2_data, window)

    # 將斜率資料合併成DataFrame並對齊數據
    combined_slopes = pd.DataFrame({
        'slopes1': slopes1,
        'slopes2': slopes2
    })

    # 刪除含有空值的行
    combined_slopes = combined_slopes.dropna()

    # 列印調試資訊
    print("\n資料處理前:")
    print("Slopes1 shape:", slopes1.shape)
    print("Slopes2 shape:", slopes2.shape)
    print("NaN in slopes1:", slopes1.isna().sum())
    print("NaN in slopes2:", slopes2.isna().sum())

    print("\n數據處理後:")
    print("Combined shape:", combined_slopes.shape)
    print("NaN in combined data:", combined_slopes.isna().sum().sum())

    # 計算滾動相關性
    correlation = combined_slopes['slopes1'].rolling(window).corr(combined_slopes['slopes2'])

    # 計算領先-滯後關係
    lead_lag = pd.DataFrame(index=combined_slopes.index)
    for lag in range(-5, 6):
        if lag > 0:
            shifted_slopes2 = combined_slopes['slopes2'].shift(lag)
            corr = combined_slopes['slopes1'].rolling(window).corr(shifted_slopes2)
        else:
            shifted_slopes1 = combined_slopes['slopes1'].shift(-lag)
            corr = shifted_slopes1.rolling(window).corr(combined_slopes['slopes2'])

        lead_lag[f'lag_{lag}'] = corr

    print("\n結果統計:")
    print("Correlation NaN count:", correlation.isna().sum())
    print("Total periods in correlation:", len(correlation))

    return correlation, lead_lag


def visualize_cross_market_analysis(correlation, lead_lag):
    """
    可視化跨市場分析結果

    參數:
    correlation: 相關性時間序列
    lead_lag: 領先-滯後關係DataFrame
    """
    # 建立具有共享x軸的子圖
    fig, (ax1, ax2) = plt.subplots(2, 1, figsize=(12, 8), sharex=True)

    # 繪製相關性時間序列
    ax1.plot(range(len(correlation)), correlation.values, label='相關性')
    ax1.set_title('斜率相關性隨時間的變化')
    ax1.axhline(y=0, color='r', linestyle='--', alpha=0.3)
    ax1.grid(True)
    ax1.set_ylabel('相關性')

    # 設定第一個圖的x軸刻度
    n_ticks = 5  # 設定想要顯示的刻度數量
    step = len(correlation) // (n_ticks - 1)
    tick_positions = np.arange(0, len(correlation), step)
    tick_labels = correlation.index[::step]
    ax1.set_xticks(tick_positions)
    ax1.set_xticklabels(tick_labels, rotation=45)

    # 繪製領先-滯後熱圖
    im = ax2.imshow(lead_lag.T,
                    aspect='auto',
                    extent=[0, len(lead_lag), -5.5, 5.5],
                    cmap='RdBu_r',
                    interpolation='nearest')

    # 設定第二個圖的x軸刻度(與第一個圖相同)
    ax2.set_xticks(tick_positions)
    ax2.set_xticklabels(tick_labels, rotation=45)

    # 設定y軸標籤
    ax2.set_ylabel('領先/滯後週期')
    ax2.set_title('領先-滯後關係分析')

    # 新增色條
    plt.colorbar(im, ax=ax2, label='相關性強度')

    # 調整佈局
    plt.tight_layout()

    return fig

def enhanced_visualize_cross_market_analysis(correlation, lead_lag,
                                           title=None,
                                           show_threshold=False,
                                           threshold=0.5):
    """
    增強版視覺化函數
    """
    # 建立具有共享x軸的子圖
    fig, (ax1, ax2) = plt.subplots(2, 1, figsize=(12, 8), sharex=True)

    if title:
        fig.suptitle(title, y=1.02, fontsize=14)

    # 繪製相關性時間序列
    ax1.plot(range(len(correlation)), correlation.values, label='相關性')
    ax1.set_title('斜率相關性隨時間的變化')
    ax1.axhline(y=0, color='r', linestyle='--', alpha=0.3, label='零線')

    if show_threshold:
        ax1.axhline(y=threshold, color='g', linestyle='--', alpha=0.3, label=f'閾值 ({threshold})')
        ax1.axhline(y=-threshold, color='g', linestyle='--', alpha=0.3)

    ax1.grid(True)
    ax1.set_ylabel('相關性')
    ax1.legend()

    # 設定第一個圖的x軸刻度
    n_ticks = 5  # 設定想要顯示的刻度數量
    step = len(correlation) // (n_ticks - 1)
    tick_positions = np.arange(0, len(correlation), step)
    tick_labels = correlation.index[::step]
    ax1.set_xticks(tick_positions)
    ax1.set_xticklabels(tick_labels, rotation=45)

    # 繪製領先-滯後熱圖
    im = ax2.imshow(lead_lag.T,
                    aspect='auto',
                    extent=[0, len(lead_lag), -5.5, 5.5],
                    cmap='RdBu_r',
                    interpolation='nearest')

    # 設定第二個圖的x軸刻度(與第一個圖相同)
    ax2.set_xticks(tick_positions)
    ax2.set_xticklabels(tick_labels, rotation=45)

    # 設定y軸標籤和刻度
    ax2.set_ylabel('領先/滯後週期')
    ax2.set_yticks(np.arange(-5, 6))
    ax2.set_title('領先-滯後關係分析')

    # 新增色條
    cbar = plt.colorbar(im, ax=ax2)
    cbar.set_label('相關性強度')

    # 調整佈局
    plt.tight_layout()

    return fig


# 獲得兩個品種的斜率相關性
correlation_analyze, analyze_lead_lag = analyze_cross_market_slopes(resampled_df1['close'], resampled_df2['close'])

# 只顯示5月的相關性圖表
monthly_mask3 = (correlation_analyze.index.year == 2024) & (correlation_analyze.index.month == 5)

analyze_lead_lag3 = (analyze_lead_lag.index.year == 2024) & (analyze_lead_lag.index.month == 5)
fig = visualize_cross_market_analysis(correlation_analyze[monthly_mask3], analyze_lead_lag[analyze_lead_lag3])


plt.show()
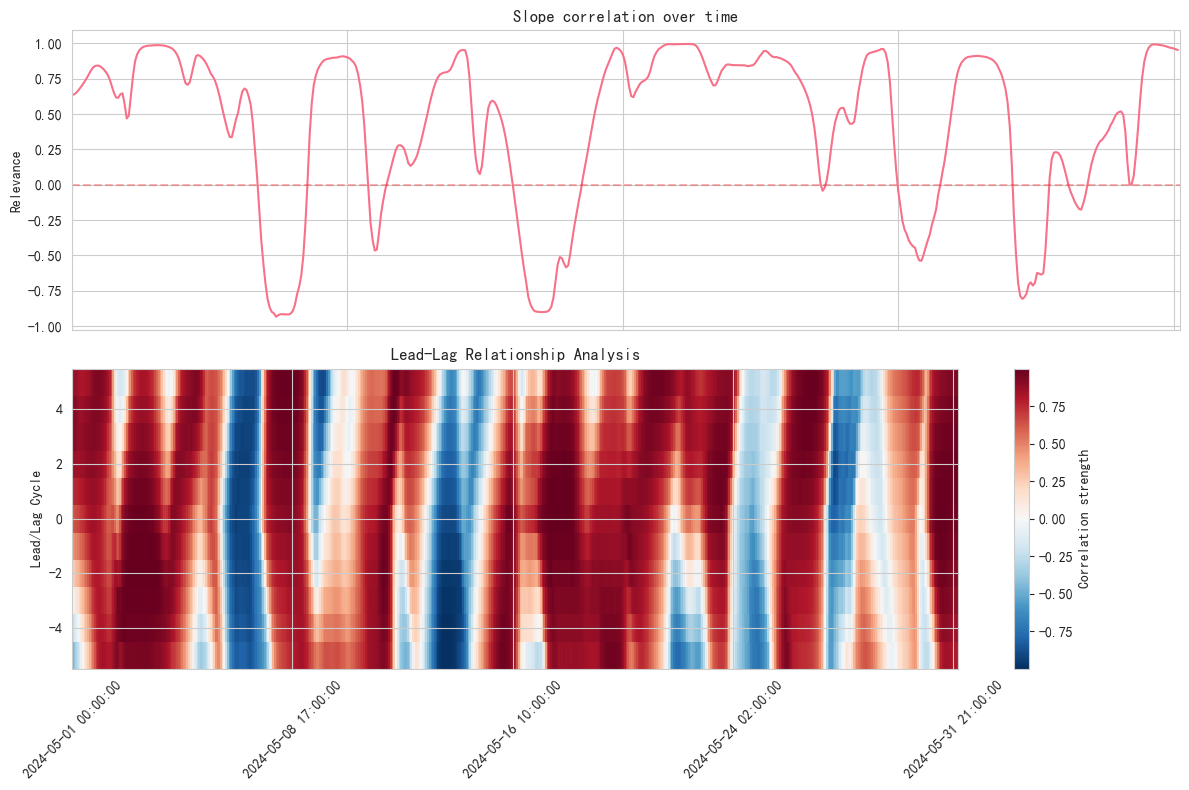
透過這個分析,我們可以發現一些有趣的現象:
- EUR/USD與黃金價格的斜率相關性往往在特定的市場環境下會顯著增強
- 這種相關性可能存在領先-滯後關係,為預測提供了可能性
- 相關性的突然變化可能預示著市場環境的轉變
3.2 股指與個股斜率的聯繫
在股票市場中,個股與大盤之間的斜率關係同樣值得研究:
這種分析方法幫助我們:
- 辨識個股的獨特走勢
- 發現潛在的alpha機會
- 優化投資組合的風險管理
值得注意的是,這些跨市場關係並非一成不變。在我們的下一篇文章中,我們將探討如何將這些關係整合到實際的交易策略中。現在,讓我們繼續深入研究如何開發更複雜的多維度斜率指標。


