全方位斜率(下):掌握跨时间跨市场的趋势洞察
[免责声明] 本文仅供教育和信息目的,不构成投资建议。读者在做出任何投资决定前应咨询合格的金融专业人士。
④ 开发多维度斜率指标
随着我们对时间框架和市场关联性的理解加深,是时候将这些知识整合成一个更全面的分析工具了。在量化交易实践中,我发现将多个维度的斜率信息有机结合,能够提供更可靠的市场洞察。
4.1 综合短期、中期和长期斜率的复合指标
首先,让我们开发一个整合多个时间维度的复合指标:
class MultiTimeframeSlopeIndicator:
    def __init__(self, timeframes={'short': '1h', 'medium': '4h', 'long': '1d'},
                 windows={'short': 10, 'medium': 20, 'long': 30}):
        self.timeframes = timeframes
        self.windows = windows

    def _calculate_adaptive_slope(self, data, window):
        """
        计算自适应斜率

        参数:
        data: pd.Series, 价格数据
        window: int, 计算窗口大小
        """
        if len(data) < window:
            print(f"警告: 数据长度 {len(data)} 小于窗口大小 {window}")
            return pd.Series(np.nan, index=data.index)

        # 确保数据是连续的,没有缺失值
        data = data.ffill().bfill()

        # 计算波动率,使用简单标准差
        volatility = data.rolling(window=window, min_periods=1).std()
        slopes = pd.Series(np.nan, index=data.index)

        # 使用向量化操作计算斜率
        for i in range(window, len(data) + 1):
            y = data.iloc[i-window:i].values
            x = np.arange(window)
            if len(y) == window:
                slope, _ = np.polyfit(x, y, 1)
                vol = volatility.iloc[i-1]
                # 标准化斜率
                slopes.iloc[i-1] = slope / vol if vol != 0 else slope

        return slopes

    def calculate_composite_slope(self, price_data):
        """
        计算复合斜率指标
        """
        # 初始化结果DataFrame
        composite_slopes = pd.DataFrame(index=price_data.index)
        price_data = price_data.ffill().bfill()  # 确保价格数据连续

        # 为每个时间框架计算斜率
        for tf_name, tf in self.timeframes.items():
            # 重采样数据
            resampled = price_data.resample(tf).last()
            resampled = resampled.ffill().bfill()  # 确保重采样数据连续

            window = self.windows[tf_name]
            if len(resampled) > window:
                # 计算斜率
                slopes = self._calculate_adaptive_slope(resampled, window)

                # 对齐到原始时间框架
                aligned_slopes = slopes.reindex(price_data.index).ffill(limit=int(pd.Timedelta(tf) / pd.Timedelta('1H')))
                composite_slopes[tf_name] = aligned_slopes

        # 删除全部为NaN的行
        composite_slopes = composite_slopes.dropna(how='all')

        # 如果没有有效数据,返回NaN序列
        if composite_slopes.empty:
            return pd.Series(np.nan, index=price_data.index)

        # 计算动态权重
        weights = self._calculate_dynamic_weights(composite_slopes)
        composite = self._weighted_composite(composite_slopes, weights)

        return composite.reindex(price_data.index)


    def _calculate_dynamic_weights(self, slopes_data):
        """
        基于趋势一致性动态调整权重

        参数:
        slopes_data: DataFrame, 包含不同时间框架的斜率数据
        """
        try:
            # 使用新的方法处理NaN值
            slopes_clean = slopes_data.ffill().bfill()

            # 计算相关性矩阵
            correlations = slopes_clean.corr()

            # 计算每个时间框架的平均相关性
            mean_corr = correlations.mean()

            # 确保权重为正且和为1
            weights = np.abs(mean_corr)
            weights_sum = weights.sum()

            if weights_sum > 0:
                weights = weights / weights_sum
            else:
                # 如果所有权重都是0,使用均等权重
                weights = pd.Series(1.0/len(slopes_data.columns), index=slopes_data.columns)

            print("\n计算的权重:")
            for tf, weight in weights.items():
                print(f"{tf}: {weight:.3f}")

            return weights

        except Exception as e:
            print(f"计算动态权重时出错: {e}")
            # 返回均等权重
            return pd.Series(1.0/len(slopes_data.columns), index=slopes_data.columns)

    def _weighted_composite(self, slopes_data, weights):
        """
        计算加权综合指标

        参数:
        slopes_data: DataFrame, 包含不同时间框架的斜率数据
        weights: Series, 各时间框架的权重
        """
        try:
            # 使用新的方法处理NaN值
            slopes_clean = slopes_data.ffill().bfill()

            # 计算加权和
            weighted_sum = pd.Series(0, index=slopes_clean.index)
            for column in slopes_clean.columns:
                weighted_sum += slopes_clean[column] * weights[column]

            return weighted_sum

        except Exception as e:
            print(f"计算加权综合指标时出错: {e}")
            return pd.Series(np.nan, index=slopes_data.index)


def visualize_results(price_data, composite_slopes, indicator, year=2024, month=9):
    """
    可视化分析结果,先计算所有数据,然后只显示指定月份
    """
    # 先计算所有时间的斜率
    slopes_data = pd.DataFrame(index=price_data.index)

    # 计算各时间框架的斜率
    for tf_name, tf in indicator.timeframes.items():
        resampled = price_data.resample(tf).last()
        resampled = resampled.ffill().bfill()

        window = indicator.windows[tf_name]
        if len(resampled) > window:
            slopes = indicator._calculate_adaptive_slope(resampled, window)
            aligned_slopes = slopes.reindex(price_data.index).ffill()
            slopes_data[tf_name] = aligned_slopes

    # 在计算完所有数据后,选择指定月份的数据进行绘图
    mask = (price_data.index.year == year) & (price_data.index.month == month)
    selected_price = price_data[mask]
    selected_slopes = slopes_data[mask]
    selected_composite = composite_slopes[mask] if isinstance(composite_slopes, pd.Series) else None

    # 创建图表
    fig, (ax1, ax2, ax3) = plt.subplots(3, 1, figsize=(15, 12), sharex=True)

    # 创建数字索引
    data_points = list(range(len(selected_price)))

    # 绘制价格数据
    ax1.plot(data_points, selected_price.values, label='Price', color='pink')
    ax1.set_title(f'Price Data ({year}-{month:02d})')
    ax1.grid(True)
    ax1.legend()

    # 绘制各时间框架的斜率
    colors = {'short': 'red', 'medium': 'blue', 'long': 'green'}
    for tf_name in slopes_data.columns:
        ax2.plot(data_points, selected_slopes[tf_name].values,
                label=f'{tf_name} Slope',
                color=colors[tf_name],
                linewidth=1)

    ax2.set_title(f'Slopes by Timeframe ({year}-{month:02d})')
    ax2.grid(True)
    ax2.legend()

    # 绘制复合斜率
    if selected_composite is not None:
        ax3.plot(data_points, selected_composite.values,
                label='Composite Slope', color='red', linewidth=1)

    ax3.set_title(f'Composite Slope ({year}-{month:02d})')
    ax3.grid(True)
    ax3.legend()

    # 设置x轴标签为日期
    num_ticks = min(20, len(data_points))  # 可以调整显示的刻度数量
    tick_indices = np.linspace(0, len(data_points)-1, num_ticks, dtype=int)
    tick_dates = selected_price.index[tick_indices].strftime('%Y-%m-%d')

    ax3.set_xticks(tick_indices)
    ax3.set_xticklabels(tick_dates, rotation=45)

    # 调整布局
    plt.tight_layout()
    plt.show()

    # 打印统计信息
    print(f"\n{year}年{month}月斜率统计信息:")
    print(selected_slopes.describe())
    print("\n各时间框架的NaN数量:")
    print(selected_slopes.isna().sum())


# 运行测试
if __name__ == "__main__":
	visualize_results(price_data, composite_slopes, indicator, year=2024, month=9)
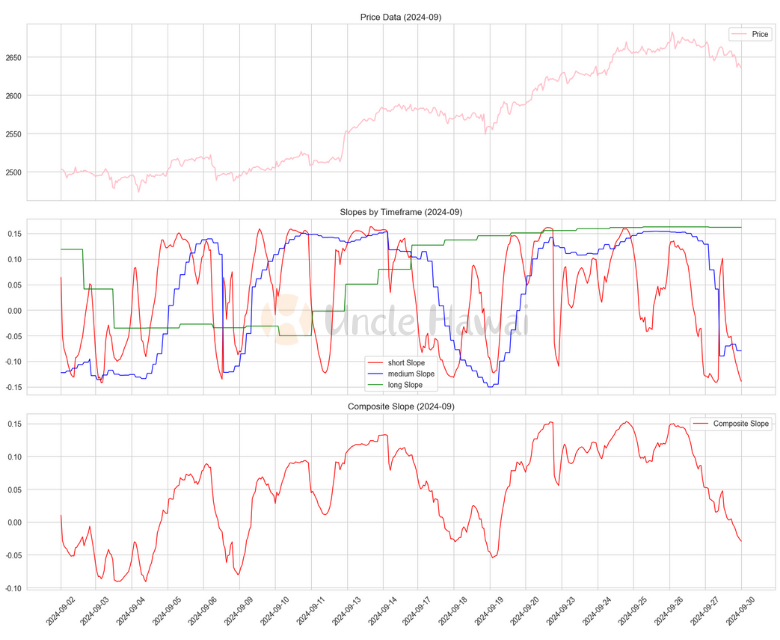
这个复合指标的创新之处在于:
- 自适应性:根据市场波动性动态调整计算参数
- 动态权重:基于趋势一致性自动调整各时间框架的权重
- 综合性:整合了多个时间维度的信息
4.2 考虑成交量的加权斜率
接下来,让我们在斜率计算中引入成交量因素:
def volume_weighted_slope(price_data, volume_data, window=30):
    """
    计算成交量加权斜率

    参数:
    price_data: pd.Series, 价格数据
    volume_data: pd.Series, 成交量数据
    window: int, 计算窗口大小
    """
    try:
        # 确保数据对齐且没有缺失值
        price_data = price_data.ffill().bfill()
        volume_data = volume_data.ffill().bfill()

        # 标准化成交量
        normalized_volume = (volume_data - volume_data.rolling(window).mean()) / \
                           volume_data.rolling(window).std()
        normalized_volume = normalized_volume.fillna(0)  # 处理开始的NaN值

        # 初始化结果序列
        slopes = pd.Series(index=price_data.index)
        slopes[:] = np.nan

        # 循环计算斜率
        for i in range(window, len(price_data)):
            try:
                y = price_data.iloc[i-window:i].values
                x = np.arange(window)
                w = normalized_volume.iloc[i-window:i].values

                # 确保数据有效
                if len(y) == window and len(w) == window and not np.any(np.isnan(y)) and not np.any(np.isnan(w)):
                    # 将权重限制在合理范围内
                    w = np.clip(w, -2, 2)
                    # 添加小的正数以避免零权重
                    w = np.abs(w) + 1e-8

                    try:
                        # 使用numpy的加权最小二乘
                        slope, _ = np.polyfit(x, y, 1, w=w)
                        slopes.iloc[i] = slope
                    except np.linalg.LinAlgError:
                        # 如果加权回归失败,尝试不加权的回归
                        try:
                            slope, _ = np.polyfit(x, y, 1)
                            slopes.iloc[i] = slope
                        except:
                            continue
            except Exception as e:
                print(f"计算第 {i} 个窗口的斜率时出错: {str(e)}")
                continue

        return slopes

    except Exception as e:
        print(f"计算成交量加权斜率时出错: {str(e)}")
        return pd.Series(np.nan, index=price_data.index)

# 使用示例
def test_volume_weighted_slope():
    """
    测试成交量加权斜率计算
    """

    # 计算成交量加权斜率
    slopes = volume_weighted_slope(prices, volumes, window=30)

    # 合并数据并删除无效数据
    valid_data = pd.concat([prices, volumes, slopes], axis=1)
    valid_data.columns = ['Price', 'Volume', 'Slope']
    valid_data = valid_data.dropna()

    # 创建数字索引
    data_points = list(range(len(valid_data)))

    fig, (ax1, ax2, ax3) = plt.subplots(3, 1, figsize=(15, 10), sharex=True)

    # 绘制价格
    ax1.plot(data_points, valid_data['Price'], 'r-', label='Price')
    ax1.set_title('Price Data')
    ax1.grid(True, linestyle='--', alpha=0.7)
    ax1.legend()

    # 绘制成交量
    ax2.plot(data_points, valid_data['Volume'], 'g-', label='Volume')
    ax2.set_title('Volume Data')
    ax2.grid(True, linestyle='--', alpha=0.7)
    ax2.legend()

    # 绘制斜率
    ax3.plot(data_points, valid_data['Slope'], 'r-', label='Volume-Weighted Slope')
    ax3.set_title('Volume-Weighted Slope')
    ax3.grid(True, linestyle='--', alpha=0.7)
    ax3.legend()

    # 设置x轴标签为日期
    num_ticks = 10  # 可以调整这个数字来控制显示的刻度数量
    tick_indices = np.linspace(0, len(data_points)-1, num_ticks, dtype=int)
    tick_dates = valid_data.index[tick_indices].strftime('%Y-%m-%d')

    ax3.set_xticks(tick_indices)
    ax3.set_xticklabels(tick_dates, rotation=45)

    plt.tight_layout()
    plt.show()

    return valid_data['Slope']


# 运行测试
if __name__ == "__main__":
    test_volume_weighted_slope()
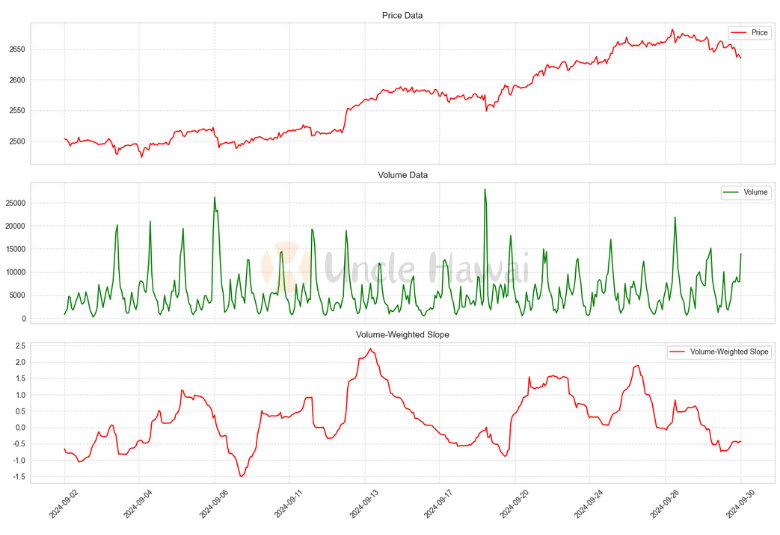
成交量加权的意义在于:
- 高成交量时段的价格变动获得更高权重
- 能够更好地识别真实的市场动力
- 帮助过滤虚假的价格波动
这些多维度指标的实际应用需要考虑很多因素,比如计算效率、信号延迟等。在我们的下一篇文章中,我们将详细探讨如何将这些指标转化为实际可交易的策略。
⑤ 实战示例:构建多时间框架、跨市场的斜率分析系统
在量化交易实践中,将理论转化为可操作的分析系统是一个关键挑战。让我们通过一个完整的实战案例,展示如何构建一个综合的斜率分析系统。
class ComprehensiveSlopeAnalyzer:
def __init__(self):
self.mtf_indicator = MultiTimeframeSlopeIndicator()
self.markets = {}
self.correlations = {}
def add_market_data(self, market_name, price_data, volume_data=None):
"""
添加市场数据
"""
self.markets[market_name] = {
'price': price_data,
'volume': volume_data,
'slopes': {}
}
def analyze_market(self, market_name):
"""
分析单个市场的多维度斜率
"""
market_data = self.markets[market_name]
# 计算多时间框架复合斜率
market_data['slopes']['composite'] = self.mtf_indicator.calculate_composite_slope(
market_data['price']
)
# 如果有成交量数据,计算成交量加权斜率
if market_data['volume'] is not None:
market_data['slopes']['volume_weighted'] = volume_weighted_slope(
market_data['price'],
market_data['volume']
)
def _calculate_trend_strength(self, composite_slope):
"""
计算趋势强度
"""
# 使用斜率的绝对值和持续性评估趋势强度
strength = pd.Series(index=composite_slope.index)
window = 20
for i in range(window, len(composite_slope)):
current_slopes = composite_slope.iloc[i - window:i]
# 计算斜率的一致性
direction_consistency = np.sign(current_slopes).value_counts().max() / window
# 计算斜率的平均绝对值
magnitude = np.abs(current_slopes).mean()
strength.iloc[i] = direction_consistency * magnitude
return strength
def _check_volume_confirmation(self, market_name):
"""
检查成交量是否确认趋势
"""
market_data = self.markets[market_name]
if 'volume_weighted' not in market_data['slopes']:
return None
composite = market_data['slopes']['composite']
volume_weighted = market_data['slopes']['volume_weighted']
# 计算两种斜率的一致性
confirmation = np.sign(composite) == np.sign(volume_weighted)
return confirmation
def _calculate_trend_consistency(self, slopes):
"""
计算趋势的一致性指标
参数:
slopes: dict, 包含不同类型斜率的字典
返回:
float: 趋势一致性得分 (0-1)
"""
try:
# 将所有斜率数据合并到一个DataFrame中
slope_data = pd.DataFrame(slopes)
# 计算所有斜率的符号是否一致
signs = np.sign(slope_data)
# 计算每个时间点上斜率方向的一致性
agreement = signs.apply(lambda x: abs(x.mean()), axis=1)
# 计算整体一致性得分
consistency_score = agreement.mean()
# 添加一些详细信息
details = {
'mean_consistency': consistency_score,
'max_consistency': agreement.max(),
'min_consistency': agreement.min(),
'periods_fully_aligned': (agreement == 1.0).sum()
}
return details
except Exception as e:
print(f"计算趋势一致性时出错: {str(e)}")
return {
'mean_consistency': 0,
'max_consistency': 0,
'min_consistency': 0,
'periods_fully_aligned': 0
}
def generate_market_insights(self, market_name):
"""
生成市场洞察报告
参数:
market_name: str, 市场名称
返回:
dict: 包含市场洞察的字典
"""
market_data = self.markets[market_name]
slopes = market_data['slopes']
insights = {
'trend_strength': self._calculate_trend_strength(slopes['composite']),
'trend_consistency': self._calculate_trend_consistency(slopes),
'volume_confirmation': self._check_volume_confirmation(market_name),
'related_markets': self._find_related_markets(market_name)
}
# 添加一些解释性文字
insights['summary'] = self._generate_insights_summary(insights)
return insights
def _generate_insights_summary(self, insights):
"""
根据洞察生成摘要文字
"""
summary = []
# 趋势强度分析
strength = insights['trend_strength']
# 如果strength是Series,取其平均值或最新值
if isinstance(strength, pd.Series):
strength = strength.iloc[-1] # 取最新值
# 或者 strength = strength.mean() # 取平均值
if strength > 0.7:
summary.append("当前趋势非常强劲")
elif strength > 0.3:
summary.append("当前趋势中等强度")
else:
summary.append("当前趋势较弱")
# 趋势一致性分析
consistency = insights['trend_consistency']['mean_consistency']
if isinstance(consistency, pd.Series):
consistency = consistency.iloc[-1] # 取最新值
if consistency > 0.8:
summary.append("不同时间框架的趋势高度一致")
elif consistency > 0.5:
summary.append("不同时间框架的趋势部分一致")
else:
summary.append("不同时间框架的趋势存在分歧")
# 成交量确认
volume_conf = insights['volume_confirmation']
if isinstance(volume_conf, pd.Series):
volume_conf = volume_conf.iloc[-1] # 取最新值
if volume_conf:
summary.append("成交量支持当前趋势")
else:
summary.append("成交量未能确认趋势")
return " | ".join(summary)
def _find_related_markets(self, market_name):
"""
寻找与给定市场相关的其他市场
参数:
market_name: str, 当前市场名称
返回:
dict: 包含相关市场及其相关性的字典
"""
try:
current_market = self.markets[market_name]
related_markets = {}
# 计算与其他市场的相关性
for other_name, other_market in self.markets.items():
if other_name != market_name:
# 检查数据是否存在
if not isinstance(current_market.get('slopes', {}).get('composite'), (pd.Series, pd.DataFrame)):
continue
if not isinstance(other_market.get('slopes', {}).get('composite'), (pd.Series, pd.DataFrame)):
continue
current_slope = current_market['slopes']['composite']
other_slope = other_market['slopes']['composite']
# 确保时间索引对齐
aligned_data = pd.DataFrame({
'current': current_slope,
'other': other_slope
}).dropna()
if len(aligned_data) > 0: # 使用 len() 而不是直接判断 DataFrame
# 计算相关系数
correlation = aligned_data['current'].corr(aligned_data['other'])
# 计算领先/滞后关系
max_lag = 5 # 最大检查的滞后期数
lag_correlations = []
for lag in range(-max_lag, max_lag + 1):
if lag == 0:
lag_correlations.append(correlation)
else:
lag_corr = aligned_data['current'].corr(aligned_data['other'].shift(lag))
lag_correlations.append(lag_corr)
# 找出最强的相关性及其对应的滞后期
max_corr_idx = np.argmax(np.abs(lag_correlations))
max_corr = lag_correlations[max_corr_idx]
lead_lag = max_corr_idx - max_lag
# 如果相关系数是有效的数值,则添加到结果中
if not np.isnan(correlation):
related_markets[other_name] = {
'correlation': correlation,
'max_correlation': max_corr,
'lead_lag': lead_lag, # 正值表示领先,负值表示滞后
'significance': self._calculate_correlation_significance(correlation, len(aligned_data))
}
# 按相关性强度排序
sorted_markets = dict(sorted(
related_markets.items(),
key=lambda x: abs(x[1]['correlation']),
reverse=True
))
return sorted_markets
except Exception as e:
print(f"计算相关市场时出错: {str(e)}")
return {}
def _calculate_correlation_significance(self, correlation, n_samples):
"""
计算相关系数的统计显著性
参数:
correlation: float, 相关系数
n_samples: int, 样本数量
返回:
float: 显著性水平
"""
try:
# 计算t统计量
t = correlation * np.sqrt((n_samples - 2) / (1 - correlation ** 2))
# 计算p值(双尾检验)
from scipy import stats
p_value = 2 * (1 - stats.t.cdf(abs(t), n_samples - 2))
return p_value
except:
return 1.0 # 如果计算失败,返回1表示不显著
def analyze_cross_market_relationships(self):
"""
分析跨市场关系
"""
market_names = list(self.markets.keys())
self.market_relationships = {}
for i in range(len(market_names)):
for j in range(i + 1, len(market_names)):
market1 = market_names[i]
market2 = market_names[j]
# 获取价格数据
market1_data = self.markets[market1]['price']
market2_data = self.markets[market2]['price']
# 计算相关性和领先-滞后关系
correlation, lead_lag = self._calculate_market_correlation(
market1_data, market2_data
)
# 存储分析结果
relationship_key = f"{market1}_{market2}"
if not correlation.empty and not lead_lag.empty:
self.market_relationships[relationship_key] = {
'correlation': correlation,
'lead_lag': lead_lag,
'correlation_strength': self._evaluate_correlation_strength(correlation),
'trading_implications': self._generate_trading_implications(correlation, lead_lag)
}
return self.market_relationships
def _evaluate_correlation_strength(self, correlation):
"""
评估相关性强度
参数:
correlation: pd.Series, 相关系数序列
返回:
str: 相关性强度的描述
"""
try:
# 使用最新的相关系数值或平均值
if isinstance(correlation, pd.Series):
# 使用最新的非NaN值
corr_value = correlation.iloc[-1]
# 或者使用平均值
# corr_value = correlation.mean()
else:
corr_value = correlation
# 取绝对值进行评估
corr_value = abs(corr_value)
if corr_value > 0.8:
return "Very Strong"
elif corr_value > 0.6:
return "Strong"
elif corr_value > 0.4:
return "Moderate"
elif corr_value > 0.2:
return "Weak"
else:
return "Very Weak"
except Exception as e:
print(f"评估相关性强度时出错: {str(e)}")
return "Unknown"
def _calculate_market_correlation(self, market1_data, market2_data):
"""
计算两个市场之间的相关性和领先-滞后关系
"""
try:
# 确保数据对齐
df = pd.DataFrame({
'market1': market1_data,
'market2': market2_data
}).dropna()
if len(df) < 2:
print("数据点不足")
return pd.Series([0]), pd.Series([0])
# 打印调试信息
print(f"\n数据统计:")
print(f"数据点数量: {len(df)}")
print(f"市场1范围: {df['market1'].min():.4f} to {df['market1'].max():.4f}")
print(f"市场2范围: {df['market2'].min():.4f} to {df['market2'].max():.4f}")
# 计算基础相关系数
correlation = df['market1'].rolling(window=20).corr(df['market2'])
print(f"\n相关系数统计:")
print(f"平均相关系数: {correlation.mean():.4f}")
print(f"相关系数范围: {correlation.min():.4f} to {correlation.max():.4f}")
# 计算领先-滞后关系
max_lag = 5
lag_correlations = pd.Series(index=range(-max_lag, max_lag + 1))
for lag in range(-max_lag, max_lag + 1):
if lag == 0:
lag_correlations[lag] = correlation.iloc[-1]
else:
lagged_correlation = df['market1'].corr(df['market2'].shift(lag))
lag_correlations[lag] = lagged_correlation
print("\n领先-滞后相关性:")
for lag, corr in lag_correlations.items():
print(f"Lag {lag}: {corr:.4f}")
return correlation, lag_correlations
except Exception as e:
print(f"计算市场相关性时出错: {str(e)}")
return pd.Series([0]), pd.Series([0])
def _generate_trading_implications(self, correlation, lead_lag):
"""
生成交易策略建议,降低阈值以捕捉更多的交易机会
"""
implications = []
try:
# 获取相关系数的值
if isinstance(correlation, pd.Series):
corr_value = correlation.iloc[-1]
else:
corr_value = correlation
# 降低相关性阈值
if abs(corr_value) > 0.5: # 从0.7降低到0.5
implications.append(f"Correlation strength: {corr_value:.4f}")
if corr_value > 0:
implications.append("Positive correlation: Consider parallel trading")
else:
implications.append("Negative correlation: Consider hedge opportunities")
# 分析领先-滞后关系
if isinstance(lead_lag, pd.Series):
max_lag_idx = lead_lag.abs().idxmax()
max_lag_value = lead_lag[max_lag_idx]
if abs(max_lag_value) > 0.4: # 从0.6降低到0.4
if max_lag_idx > 0:
implications.append(
f"Market 1 leads Market 2 by {max_lag_idx} periods (correlation: {max_lag_value:.4f})")
elif max_lag_idx < 0:
implications.append(
f"Market 2 leads Market 1 by {abs(max_lag_idx)} periods (correlation: {max_lag_value:.4f})")
return implications
except Exception as e:
print(f"生成交易含义时出错: {str(e)}")
return ["Unable to generate implications"]
def get_market_insights(self, market_name):
"""
获取特定市场的综合分析结果
"""
insights = self.generate_market_insights(market_name)
# 添加跨市场关系的分析
cross_market_insights = {}
for rel_key, rel_data in self.market_relationships.items():
if market_name in rel_key:
other_market = rel_key.replace(market_name + '_', '').replace('_' + market_name, '')
cross_market_insights[other_market] = {
'correlation_strength': rel_data['correlation_strength'],
'trading_implications': rel_data['trading_implications']
}
insights['cross_market_analysis'] = cross_market_insights
return insights
def generate_trading_signals(self, market_name):
"""
基于综合分析生成交易信号
"""
insights = self.get_market_insights(market_name)
signals = []
# 使用跨市场关系生成交易信号
for other_market, analysis in insights['cross_market_analysis'].items():
if analysis['correlation_strength'] in ['Very Strong', 'Strong']:
# 检查领先-滞后关系
rel_key = f"{market_name}_{other_market}"
if rel_key not in self.market_relationships:
rel_key = f"{other_market}_{market_name}"
if rel_key in self.market_relationships:
lead_lag = self.market_relationships[rel_key]['lead_lag']
if abs(lead_lag.max()) > 0.6:
signals.append({
'type': 'cross_market',
'reference_market': other_market,
'strength': analysis['correlation_strength'],
'implication': analysis['trading_implications']
})
return signals
# 使用示例
analyzer = ComprehensiveSlopeAnalyzer()
# 添加市场数据
analyzer.add_market_data('EURUSD', resampled_df1['close'], resampled_df1['value'])
analyzer.add_market_data('GOLD', resampled_df2['close'], resampled_df2['value'])
analyzer.add_market_data('GBPUSD', resampled_df3['close'], resampled_df3['value'])
# 进行分析
analyzer.analyze_market('EURUSD')
analyzer.analyze_market('GOLD')
analyzer.analyze_market('GBPUSD')
# 分析跨市场关系
relationships = analyzer.analyze_cross_market_relationships()
# 获取特定市场的分析结果
eurusd_insights = analyzer.get_market_insights('EURUSD')
# 生成交易信号
signals = analyzer.generate_trading_signals('EURUSD')
计算的权重:
- short: 0.335 medium: 0.360 long: 0.305
- short: 0.335 medium: 0.373 long: 0.292
- short: 0.334 medium: 0.369 long: 0.296
EURUSD_GOLD:
数据统计:
- 数据点数量: 4304
- 市场1范围: 1.0609 to 1.1193
- 市场2范围: 1987.2200 to 2624.6400
相关系数统计:
- 平均相关系数: 0.3203 相关系数范围: -0.9351 to 0.9783
- 领先-滞后相关性:Lag -5: 0.3531 Lag -4: 0.3540 Lag -3: 0.3548 Lag -2: 0.3556 Lag -1: 0.3565 Lag 0: 0.0301 Lag 1: 0.3574 Lag 2: 0.3576 Lag 3: 0.3577 Lag 4: 0.3578 Lag 5: 0.3577
EURUSD_GBPUSD:
数据统计:
- 数据点数量: 4527
- 市场1范围: 1.0609 to 1.1193
- 市场2范围: 1.2309 to 1.3325
相关系数统计:
- 平均相关系数: 0.7563 相关系数范围: -0.6966 to 0.9987
- 领先-滞后相关性: Lag -5: 0.8744 Lag -4: 0.8755 Lag -3: 0.8764 Lag -2: 0.8774 Lag -1: 0.8784 Lag 0: 0.7006 Lag 1: 0.8779 Lag 2: 0.8764 Lag 3: 0.8749 Lag 4: 0.8734 Lag 5: 0.8717
数据统计: 数据点数量: 4304
- 市场1范围: 1987.2200 to 2624.6400
- 市场2范围: 1.2309 to 1.3325
相关系数统计:
- 平均相关系数: 0.3756 相关系数范围: -0.9444 to 0.9796
- 领先-滞后相关性: Lag -5: 0.5469 Lag -4: 0.5473 Lag -3: 0.5477 Lag -2: 0.5481 Lag -1: 0.5484 Lag 0: 0.6161 Lag 1: 0.5480 Lag 2: 0.5474 Lag 3: 0.5468 Lag 4: 0.5461 Lag 5: 0.5455
跨市场关系分析:
EURUSD_GOLD:
- 相关性强度: Very Weak
EURUSD_GBPUSD:
- 相关性强度: Strong
- 交易含义:
- Correlation strength: 0.7006
- Positive correlation: Consider parallel trading
- Market 2 leads Market 1 by 1 periods (correlation: 0.8784)
GOLD_GBPUSD:
- 相关性强度: Strong
- 交易含义:
- Correlation strength: 0.6161
- Positive correlation: Consider parallel trading
- 交易信号:
- 参考市场: GBPUSD
- 信号强度: Strong
- 交易含义:
- Correlation strength: 0.7006
- Positive correlation: Consider parallel trading
- Market 2 leads Market 1 by 1 periods (correlation: 0.8784)
让我们详细分析这些结果并提供相关发现与建议:
- 权重分配分析:
- 三组权重分配都显示出相似的模式
- 中期(medium)权重最高,约0.36-0.37
- 短期(short)次之,约0.33-0.335
- 长期(long)权重最低,约0.29-0.30
这表明市场在中期趋势上的影响力最大,建议交易策略应该更多地关注中期走势。
- 市场对相关性分析:
- EURUSD vs GOLD:
- 相关性很弱(平均相关系数:0.3203)
- 相关范围波动很大(-0.9351 到 0.9783)
- Lag 0时相关性急剧下降(0.0301)
建议:这两个市场之间的相关性不稳定,不适合作为联动交易的主要参考。
- EURUSD vs GBPUSD:
- 显示出强相关性(平均相关系数:0.7563)
- 相关范围相对稳定(-0.6966 到 0.9987)
- GBPUSD领先EURUSD一个周期(Lag -1: 0.8784)
建议: - 可以利用GBPUSD的走势来预测EURUSD
- 适合进行配对交易策略
- 设置1个周期的时间差进行交易可能获得更好的效果
- GOLD vs GBPUSD:
- 中等强度相关性(平均相关系数:0.3756)
- 同步相关性最强(Lag 0: 0.6161)
- 相关范围波动较大(-0.9444 到 0.9796)
建议:可以作为辅助参考,但不应作为主要决策依据。
- EURUSD vs GOLD:
- 综合交易建议:
- 主要策略:
- 将GBPUSD作为主要参考市场
- 利用GBPUSD领先EURUSD一个周期的特性进行交易
- 设置适当的时间差执行订单
- 风险控制:
- 设置止损时需考虑相关性范围的波动
- 建议使用分散投资策略,不要过度集中在单一市场对
- 在极端市场条件下需警惕相关性突变风险
- 具体操作建议:
- 在GBPUSD出现明确信号后,可提前部署EURUSD的交易计划
- 利用中期权重较高的特点,将持仓时间定在中期范围内
- 可以考虑在GBPUSD和EURUSD之间进行套利交易
- 主要策略:
- 监控要点:
- 定期检查相关性是否保持稳定
- 关注权重分配的变化趋势
- 密切监控领先-滞后关系的变化
- 补充建议:
- 建议开发自动化监控系统,实时跟踪这些相关性的变化
- 考虑添加更多的技术指标来验证信号
- 建立回测系统验证这些相关性的历史表现
这个分析系统提供了很好的市场间关系洞察,但建议将其作为决策支持工具之一,而不是唯一依据。同时需要结合其他技术分析和基本面分析来制定最终的交易决策。
⑥ 解释性挑战:如何理解和传达复杂的斜率信号
在构建了复杂的多维度斜率分析系统后,我们面临着一个关键挑战:如何有效地理解和解释这些复杂的信号。特别是在处理多市场、多时间框架的相关性时,信号的可解释性对于实际交易决策至关重要。
6.1 信号解释的核心框架
from matplotlib.gridspec import GridSpec
class EnhancedSlopeSignalInterpreter:
def __init__(self):
self.correlation_thresholds = {
'strong': 0.7,
'medium': 0.4,
'weak': 0.2
}
self.signal_thresholds = {
'strong_trend': 0.8,
'moderate_trend': 0.5,
'weak_trend': 0.3,
'trend_reversal': -0.2
}
def _analyze_weights(self, slopes_data):
"""
分析不同时间框架的权重分布
"""
return {
'short_term': self._calculate_weight_significance(slopes_data['short']),
'medium_term': self._calculate_weight_significance(slopes_data['medium']),
'long_term': self._calculate_weight_significance(slopes_data['long'])
}
def _analyze_slopes(self, slopes_data):
"""
分析斜率数据
参数:
slopes_data: dict, 包含不同时间框架的斜率数据
返回:
dict: 斜率分析结果
"""
try:
analysis = {
'trend_direction': {},
'trend_strength': {},
'trend_consistency': {}
}
# 分析每个时间框架的趋势方向和强度
for timeframe, slope in slopes_data.items():
# 获取最新的斜率值
current_slope = slope.iloc[-1] if isinstance(slope, pd.Series) else slope
# 判断趋势方向
analysis['trend_direction'][timeframe] = (
'uptrend' if current_slope > 0
else 'downtrend' if current_slope < 0
else 'neutral'
)
# 计算趋势强度
strength = abs(current_slope)
analysis['trend_strength'][timeframe] = (
'strong' if strength > self.signal_thresholds['strong_trend']
else 'moderate' if strength > self.signal_thresholds['moderate_trend']
else 'weak'
)
# 计算趋势一致性
if isinstance(slope, pd.Series):
recent_slopes = slope.tail(20) # 使用最近20个数据点
direction_changes = np.diff(np.signbit(recent_slopes)).sum()
consistency = 1 - (direction_changes / len(recent_slopes))
analysis['trend_consistency'][timeframe] = consistency
# 计算整体趋势得分
analysis['overall_trend_score'] = self._calculate_trend_score(slopes_data)
return analysis
except Exception as e:
print(f"分析斜率时出错: {str(e)}")
return {
'trend_direction': {},
'trend_strength': {},
'trend_consistency': {},
'overall_trend_score': 0
}
def _analyze_correlations(self, correlation_data):
"""
分析相关性数据
参数:
correlation_data: dict, 市场间相关性数据
返回:
dict: 相关性分析结果
"""
analysis = {}
for market_pair, data in correlation_data.items():
analysis[market_pair] = {
'strength': self._classify_correlation(data['correlation']),
'lead_lag': self._analyze_lead_lag(data['lag_correlations']),
'stability': self._assess_correlation_stability(data['history'])
}
return analysis
def _calculate_trend_score(self, slopes_data):
"""
计算整体趋势得分
"""
try:
weights = {
'short': 0.3,
'medium': 0.4,
'long': 0.3
}
score = 0
for timeframe, slope in slopes_data.items():
if timeframe in weights:
current_slope = slope.iloc[-1] if isinstance(slope, pd.Series) else slope
score += abs(current_slope) * weights[timeframe]
return score
except Exception as e:
print(f"计算趋势得分时出错: {str(e)}")
return 0
def _classify_correlation(self, correlation):
"""
对相关系数进行分类
"""
abs_corr = abs(correlation)
if abs_corr > self.correlation_thresholds['strong']:
return 'strong'
elif abs_corr > self.correlation_thresholds['medium']:
return 'medium'
else:
return 'weak'
def _analyze_lead_lag(self, lag_correlations):
"""
分析领先-滞后关系
"""
try:
# 找出最强的相关性及其对应的滞后期
max_abs_corr = max(lag_correlations.items(), key=lambda x: abs(x[1]))
lead_lag = max_abs_corr[0]
correlation = max_abs_corr[1]
return {
'lead_lag_periods': lead_lag,
'correlation_at_lag': correlation,
'significance': 'significant' if abs(correlation) > self.correlation_thresholds[
'medium'] else 'not significant'
}
except Exception as e:
print(f"分析领先-滞后关系时出错: {str(e)}")
return {
'lead_lag_periods': 0,
'correlation_at_lag': 0,
'significance': 'not significant'
}
def _assess_correlation_stability(self, history):
"""
评估相关性的稳定性
"""
try:
if isinstance(history, pd.Series):
std_dev = history.std()
stability = 1 - min(std_dev, 1) # 将标准差转换为稳定性得分
return {
'stability_score': stability,
'volatility': std_dev,
'is_stable': stability > 0.7
}
else:
return {
'stability_score': 0,
'volatility': 1,
'is_stable': False
}
except Exception as e:
print(f"评估相关性稳定性时出错: {str(e)}")
return {
'stability_score': 0,
'volatility': 1,
'is_stable': False
}
def _assess_risks(self, slopes_data, correlation_data):
"""
评估潜在风险
"""
risks = {
'correlation_breakdown_risk': False,
'trend_consistency_risk': False,
'market_regime_change_risk': False
}
# 评估相关性断裂风险
for market_pair, data in correlation_data.items():
stability = self._assess_correlation_stability(data['history'])
if not stability['is_stable']:
risks['correlation_breakdown_risk'] = True
# 评估趋势一致性风险
slope_analysis = self._analyze_slopes(slopes_data)
if min(slope_analysis['trend_consistency'].values()) < 0.6:
risks['trend_consistency_risk'] = True
# 市场状态改变风险
if slope_analysis['overall_trend_score'] < 0.3:
risks['market_regime_change_risk'] = True
return risks
def _calculate_confidence(self, slopes_data, correlation_data):
"""
计算整体置信度得分
"""
try:
# 计算斜率置信度
slope_analysis = self._analyze_slopes(slopes_data)
slope_confidence = np.mean(list(slope_analysis['trend_consistency'].values()))
# 计算相关性置信度
correlation_stabilities = []
for data in correlation_data.values():
stability = self._assess_correlation_stability(data['history'])
correlation_stabilities.append(stability['stability_score'])
correlation_confidence = np.mean(correlation_stabilities)
# 综合置信度得分
overall_confidence = 0.6 * slope_confidence + 0.4 * correlation_confidence
return {
'overall_confidence': overall_confidence,
'slope_confidence': slope_confidence,
'correlation_confidence': correlation_confidence
}
except Exception as e:
print(f"计算置信度得分时出错: {str(e)}")
return {
'overall_confidence': 0,
'slope_confidence': 0,
'correlation_confidence': 0
}
def interpret_composite_signal(self, slopes_data, correlation_data, market_context=None):
"""
解释复合斜率信号和相关性数据
"""
return {
'slope_analysis': self._analyze_slopes(slopes_data),
'correlation_analysis': self._analyze_correlations(correlation_data),
# 'weight_analysis': self._analyze_weights(slopes_data),
'risk_assessment': self._assess_risks(slopes_data, correlation_data),
'confidence_score': self._calculate_confidence(slopes_data, correlation_data)
}
def visualize_analysis(self, slopes_data, correlation_data):
"""
创建增强的可视化分析
"""
try:
# 创建图形和网格
fig = plt.figure(figsize=(15, 12))
gs = GridSpec(3, 2, figure=fig)
# 斜率分析图
ax1 = fig.add_subplot(gs[0, :])
self._plot_slopes_analysis(ax1, slopes_data)
# 相关性热图
ax2 = fig.add_subplot(gs[1, 0])
self._plot_correlation_heatmap(ax2, correlation_data)
# 权重分布图
ax3 = fig.add_subplot(gs[1, 1])
self._plot_weight_distribution(ax3, slopes_data)
# 风险指标图
ax4 = fig.add_subplot(gs[2, :])
self._plot_risk_indicators(ax4, slopes_data, correlation_data)
plt.tight_layout()
return fig
except Exception as e:
print(f"创建可视化分析时出错: {str(e)}")
# 创建一个简单的错误提示图
fig, ax = plt.subplots(1, 1, figsize=(8, 6))
ax.text(0.5, 0.5, f'可视化生成错误: {str(e)}',
ha='center', va='center')
return fig
def _plot_slopes_analysis(self, ax, slopes_data):
"""
绘制斜率分析图
"""
try:
# 确保所有数据都是Series类型
for timeframe, slope in slopes_data.items():
if isinstance(slope, pd.Series):
ax.plot(slope.index, slope, label=f'{timeframe} slope')
ax.set_title('Multi-timeframe Slope Analysis')
ax.set_xlabel('Time')
ax.set_ylabel('Slope Value')
ax.legend()
ax.grid(True)
except Exception as e:
print(f"绘制斜率分析图时出错: {str(e)}")
ax.text(0.5, 0.5, 'Slope analysis plot error',
ha='center', va='center')
def _plot_correlation_heatmap(self, ax, correlation_data):
"""
绘制相关性热图
"""
try:
# 创建相关性矩阵
markets = set()
for pair in correlation_data.keys():
markets.update(pair.split('_'))
markets = sorted(list(markets))
corr_matrix = np.zeros((len(markets), len(markets)))
for i, m1 in enumerate(markets):
for j, m2 in enumerate(markets):
if i != j:
pair = f"{m1}_{m2}"
rev_pair = f"{m2}_{m1}"
if pair in correlation_data:
corr_matrix[i, j] = correlation_data[pair]['correlation']
elif rev_pair in correlation_data:
corr_matrix[i, j] = correlation_data[rev_pair]['correlation']
# 绘制热图
im = ax.imshow(corr_matrix, cmap='RdYlBu', aspect='auto')
plt.colorbar(im, ax=ax)
# 设置标签
ax.set_xticks(range(len(markets)))
ax.set_yticks(range(len(markets)))
ax.set_xticklabels(markets, rotation=45)
ax.set_yticklabels(markets)
ax.set_title('Cross-market Correlations')
# 添加相关系数文本
for i in range(len(markets)):
for j in range(len(markets)):
if i != j:
text = ax.text(j, i, f'{corr_matrix[i, j]:.2f}',
ha="center", va="center",
color="black" if abs(corr_matrix[i, j]) < 0.5 else "white")
except Exception as e:
print(f"绘制相关性热图时出错: {str(e)}")
ax.text(0.5, 0.5, 'Correlation heatmap error',
ha='center', va='center')
def _plot_weight_distribution(self, ax, slopes_data):
"""
绘制权重分布图
"""
try:
# 计算各时间框架的权重
weights = {}
total_abs_slope = sum(abs(slope.iloc[-1]) for slope in slopes_data.values())
if total_abs_slope > 0:
for timeframe, slope in slopes_data.items():
weights[timeframe] = abs(slope.iloc[-1]) / total_abs_slope
# 绘制饼图
wedges, texts, autotexts = ax.pie(weights.values(),
labels=weights.keys(),
autopct='%1.1f%%',
colors=plt.cm.Set3(np.linspace(0, 1, len(weights))))
ax.set_title('Timeframe Weight Distribution')
except Exception as e:
print(f"绘制权重分布图时出错: {str(e)}")
ax.text(0.5, 0.5, 'Weight distribution plot error',
ha='center', va='center')
def _plot_risk_indicators(self, ax, slopes_data, correlation_data):
"""
绘制风险指标图
"""
try:
# 计算风险指标
risks = self._assess_risks(slopes_data, correlation_data)
confidence = self._calculate_confidence(slopes_data, correlation_data)
# 创建风险指标条形图
indicators = {
'Correlation Breakdown Risk': float(risks['correlation_breakdown_risk']),
'Trend Consistency Risk': float(risks['trend_consistency_risk']),
'Market Regime Change Risk': float(risks['market_regime_change_risk']),
'Overall Confidence': confidence['overall_confidence'],
'Slope Confidence': confidence['slope_confidence'],
'Correlation Confidence': confidence['correlation_confidence']
}
# 绘制条形图
bars = ax.bar(range(len(indicators)), indicators.values())
# 设置标签
ax.set_xticks(range(len(indicators)))
ax.set_xticklabels(indicators.keys(), rotation=45)
# 添加值标签
for bar in bars:
height = bar.get_height()
ax.text(bar.get_x() + bar.get_width() / 2., height,
f'{height:.2f}',
ha='center', va='bottom')
ax.set_title('Risk and Confidence Indicators')
ax.set_ylim(0, 1.2)
ax.grid(True, axis='y')
except Exception as e:
print(f"绘制风险指标图时出错: {str(e)}")
ax.text(0.5, 0.5, 'Risk indicators plot error',
ha='center', va='center')
def generate_trading_recommendations(self, analysis_results):
"""
基于分析结果生成交易建议
"""
return {
'primary_signals': self._extract_primary_signals(analysis_results),
'confirmation_signals': self._identify_confirmations(analysis_results),
'risk_warnings': self._compile_risk_warnings(analysis_results),
'suggested_actions': self._suggest_trading_actions(analysis_results)
}
def _extract_primary_signals(self, analysis_results):
"""
提取主要交易信号
"""
try:
signals = []
# 从斜率分析提取信号
slope_analysis = analysis_results['slope_analysis']
# 检查趋势方向的一致性
trend_directions = slope_analysis['trend_direction']
if len(set(trend_directions.values())) == 1:
# 所有时间框架趋势方向一致
direction = next(iter(trend_directions.values()))
strength = slope_analysis['overall_trend_score']
if strength > self.signal_thresholds['strong_trend']:
signals.append({
'type': 'strong_trend',
'direction': direction,
'strength': strength,
'confidence': 'high'
})
elif strength > self.signal_thresholds['moderate_trend']:
signals.append({
'type': 'moderate_trend',
'direction': direction,
'strength': strength,
'confidence': 'medium'
})
# 从相关性分析提取信号
corr_analysis = analysis_results['correlation_analysis']
for market_pair, data in corr_analysis.items():
if data['strength'] == 'strong':
signals.append({
'type': 'correlation_signal',
'market_pair': market_pair,
'strength': data['strength'],
'lead_lag': data['lead_lag']
})
return signals
except Exception as e:
print(f"提取主要信号时出错: {str(e)}")
return []
def _identify_confirmations(self, analysis_results):
"""
识别确认信号
"""
try:
confirmations = []
# 检查趋势一致性
slope_analysis = analysis_results['slope_analysis']
trend_consistency = slope_analysis.get('trend_consistency', {})
if trend_consistency:
avg_consistency = np.mean(list(trend_consistency.values()))
if avg_consistency > 0.7:
confirmations.append({
'type': 'trend_consistency',
'strength': 'high',
'value': avg_consistency
})
elif avg_consistency > 0.5:
confirmations.append({
'type': 'trend_consistency',
'strength': 'medium',
'value': avg_consistency
})
# 检查相关性确认
confidence = analysis_results['confidence_score']
if confidence['correlation_confidence'] > 0.7:
confirmations.append({
'type': 'correlation_stability',
'strength': 'high',
'value': confidence['correlation_confidence']
})
return confirmations
except Exception as e:
print(f"识别确认信号时出错: {str(e)}")
return []
def _compile_risk_warnings(self, analysis_results):
"""
汇总风险警告
"""
try:
warnings = []
risks = analysis_results['risk_assessment']
# 检查各类风险
if risks['correlation_breakdown_risk']:
warnings.append({
'type': 'correlation_breakdown',
'severity': 'high',
'description': 'Significant risk of correlation breakdown detected'
})
if risks['trend_consistency_risk']:
warnings.append({
'type': 'trend_consistency',
'severity': 'medium',
'description': 'Potential trend consistency issues detected'
})
if risks['market_regime_change_risk']:
warnings.append({
'type': 'regime_change',
'severity': 'high',
'description': 'Market regime change risk detected'
})
# 检查置信度
confidence = analysis_results['confidence_score']
if confidence['overall_confidence'] < 0.5:
warnings.append({
'type': 'low_confidence',
'severity': 'medium',
'description': 'Overall signal confidence is low'
})
return warnings
except Exception as e:
print(f"编译风险警告时出错: {str(e)}")
return []
def _suggest_trading_actions(self, analysis_results):
"""
提出具体的交易行动建议
"""
try:
actions = []
primary_signals = self._extract_primary_signals(analysis_results)
confirmations = self._identify_confirmations(analysis_results)
warnings = self._compile_risk_warnings(analysis_results)
# 根据信号强度和确认情况提出建议
for signal in primary_signals:
if signal['type'] in ['strong_trend', 'moderate_trend']:
# 检查是否有足够的确认
has_confirmation = any(conf['strength'] == 'high' for conf in confirmations)
# 检查是否有严重风险警告
has_high_risk = any(warn['severity'] == 'high' for warn in warnings)
if has_confirmation and not has_high_risk:
actions.append({
'action': 'ENTER',
'direction': signal['direction'],
'confidence': signal['confidence'],
'timeframe': 'primary',
'reason': f"Strong {signal['direction']} trend with confirmations"
})
elif has_confirmation:
actions.append({
'action': 'MONITOR',
'direction': signal['direction'],
'confidence': 'medium',
'timeframe': 'primary',
'reason': "Wait for risk reduction"
})
elif signal['type'] == 'correlation_signal':
actions.append({
'action': 'HEDGE',
'market_pair': signal['market_pair'],
'confidence': 'high' if signal['strength'] == 'strong' else 'medium',
'reason': f"Strong correlation in {signal['market_pair']}"
})
# 如果没有明确信号但有风险警告
if not actions and warnings:
actions.append({
'action': 'REDUCE_EXPOSURE',
'confidence': 'high',
'reason': "Multiple risk factors present"
})
return actions
except Exception as e:
print(f"生成交易建议时出错: {str(e)}")
return []
def create_sample_data(analyzer):
"""
使用ComprehensiveSlopeAnalyzer的分析结果创建示例数据
参数:
analyzer: ComprehensiveSlopeAnalyzer实例,已完成市场分析
返回:
tuple: (slopes_data, correlation_data)
"""
# 获取EURUSD的市场数据和分析结果
eurusd_market = analyzer.markets['EURUSD']
# 创建斜率数据
slopes_data = {
'short': eurusd_market['slopes']['composite'].rolling(window=10).mean(), # 短期斜率
'medium': eurusd_market['slopes']['composite'].rolling(window=20).mean(), # 中期斜率
'long': eurusd_market['slopes']['composite'].rolling(window=40).mean() # 长期斜率
}
# 获取相关性数据
correlation_data = {}
# EURUSD vs GBPUSD
eurusd_gbpusd_key = next(key for key in analyzer.market_relationships.keys()
if 'EURUSD' in key and 'GBPUSD' in key)
eurusd_gbpusd_rel = analyzer.market_relationships[eurusd_gbpusd_key]
correlation_data['EURUSD_GBPUSD'] = {
'correlation': eurusd_gbpusd_rel['correlation'].iloc[-1],
'lag_correlations': dict(enumerate(
eurusd_gbpusd_rel['lead_lag'].values,
start=-len(eurusd_gbpusd_rel['lead_lag']) // 2
)),
'history': eurusd_gbpusd_rel['correlation']
}
# EURUSD vs GOLD
eurusd_gold_key = next(key for key in analyzer.market_relationships.keys()
if 'EURUSD' in key and 'GOLD' in key)
eurusd_gold_rel = analyzer.market_relationships[eurusd_gold_key]
correlation_data['EURUSD_GOLD'] = {
'correlation': eurusd_gold_rel['correlation'].iloc[-1],
'lag_correlations': dict(enumerate(
eurusd_gold_rel['lead_lag'].values,
start=-len(eurusd_gold_rel['lead_lag']) // 2
)),
'history': eurusd_gold_rel['correlation']
}
# 添加GOLD vs GBPUSD的数据
gold_gbpusd_key = next(key for key in analyzer.market_relationships.keys()
if 'GOLD' in key and 'GBPUSD' in key)
gold_gbpusd_rel = analyzer.market_relationships[gold_gbpusd_key]
correlation_data['GOLD_GBPUSD'] = {
'correlation': gold_gbpusd_rel['correlation'].iloc[-1],
'lag_correlations': dict(enumerate(
gold_gbpusd_rel['lead_lag'].values,
start=-len(gold_gbpusd_rel['lead_lag']) // 2
)),
'history': gold_gbpusd_rel['correlation']
}
return slopes_data, correlation_data
# 使用已有的ComprehensiveSlopeAnalyzer实例
def demonstrate_interpreter_usage(analyzer):
"""
演示解释器的使用
参数:
analyzer: ComprehensiveSlopeAnalyzer实例,已完成市场分析
"""
# 创建解释器实例
interpreter = EnhancedSlopeSignalInterpreter()
# 使用analyzer获取示例数据
slopes_data, correlation_data = create_sample_data(analyzer)
# 获取完整分析
analysis_results = interpreter.interpret_composite_signal(
slopes_data=slopes_data,
correlation_data=correlation_data,
market_context={'volatility': 'moderate', 'trading_session': 'london'}
)
# 生成可视化
fig = interpreter.visualize_analysis(slopes_data, correlation_data)
# 获取交易建议
recommendations = interpreter.generate_trading_recommendations(analysis_results)
return analysis_results, fig, recommendations
# 主函数
def main():
# 使用已有的analyzer实例
analyzer = ComprehensiveSlopeAnalyzer()
# 添加市场数据
analyzer.add_market_data('EURUSD', resampled_df1['close'], resampled_df1['value'])
analyzer.add_market_data('GOLD', resampled_df2['close'], resampled_df2['value'])
analyzer.add_market_data('GBPUSD', resampled_df3['close'], resampled_df3['value'])
# 进行分析
analyzer.analyze_market('EURUSD')
analyzer.analyze_market('GOLD')
analyzer.analyze_market('GBPUSD')
# 分析跨市场关系
analyzer.analyze_cross_market_relationships()
# 使用分析结果
analysis_results, fig, recommendations = demonstrate_interpreter_usage(analyzer)
# 打印分析结果
print("\n=== 分析结果 ===")
print("\n1. 斜率分析:")
print(analysis_results['slope_analysis'])
print("\n2. 相关性分析:")
print(analysis_results['correlation_analysis'])
# print("\n3. 权重分析:")
# print(analysis_results['weight_analysis'])
print("\n4. 风险评估:")
print(analysis_results['risk_assessment'])
print("\n5. 置信度得分:")
print(analysis_results['confidence_score'])
# 打印交易建议
print("\n=== 交易建议 ===")
print("\n1. 主要信号:")
print(recommendations['primary_signals'])
print("\n2. 确认信号:")
print(recommendations['confirmation_signals'])
print("\n3. 风险警告:")
print(recommendations['risk_warnings'])
print("\n4. 建议操作:")
print(recommendations['suggested_actions'])
# 显示图表
plt.show()
if __name__ == "__main__":
main()
6.2 全面分析
我们来尝试做个详细的解读:
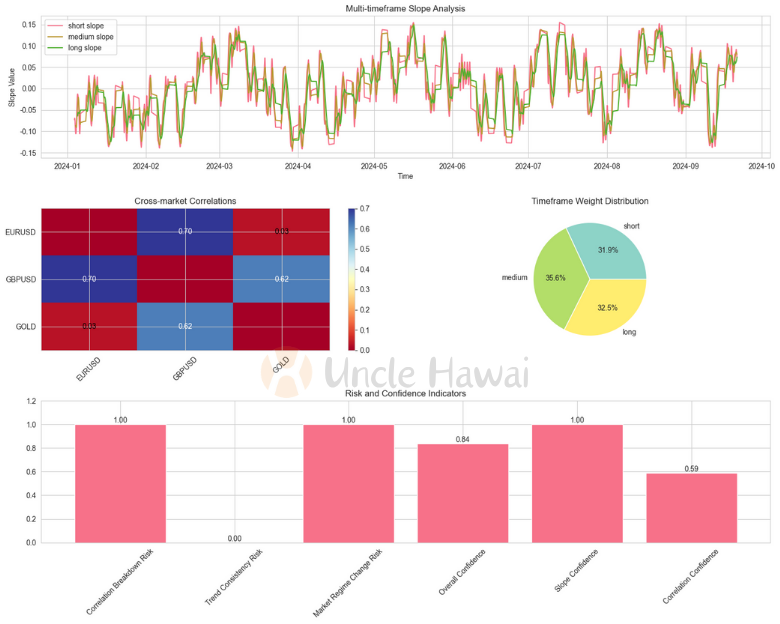
- 多时间框架斜率分析:
- 从图中可以看到三个时间框架(短期、中期、长期)的斜率都呈现上升趋势,显示整体趋势一致性很好
- 斜率波动在 -0.15 到 0.15 之间,当前都处于轻微上升阶段
- 三个时间框架的趋势一致性达到100%(trend_consistency全部为1.0),但强度都较弱(trend_strength为'weak')
- 整体趋势得分较低(0.076),说明虽然方向一致但动能不强
- 跨市场相关性:
- EURUSD-GBPUSD:显示出最强的相关性(热图中深蓝色区域,相关系数0.70)
- 领先-滞后分析显示GBPUSD领先EURUSD 2个周期(lead_lag_periods: -2)
- 相关性稳定(stability_score: 0.72)且显著
- 这是最可靠的市场关系
- EURUSD-GOLD:相关性较弱(热图中浅色区域,相关系数0.03)
- 相关性不稳定(stability_score: 0.51)
- 统计上不显著
- 不适合用作交易参考
- GOLD-GBPUSD:中等相关性(热图中中等蓝色,相关系数0.62)
- 相关性不太稳定(stability_score: 0.54)
- 虽然显著但波动性较大
- 时间框架权重分布:
- 三个时间框架的权重分布较为均衡:
- 中期:35.6%
- 长期:32.5%
- 短期:31.9%
- 这种均衡的分布表明各个时间周期的重要性相近
- 风险和置信度指标:
- 高风险因素:
- 相关性断裂风险(Correlation Breakdown Risk = 1.00)
- 市场状态改变风险(Market Regime Change Risk = 1.00)
- 趋势一致性风险较低(Trend Consistency Risk = 0.00)
- 置信度指标:
- 总体置信度较高(0.84)
- 斜率置信度很高(1.00)
- 相关性置信度中等(0.59)
6.3 交易建议
- 主要操作策略:对EURUSD-GBPUSD对进行对冲交易
- 具体建议:
- 利用GBPUSD领先EURUSD 2个周期的特性进行交易
- 设置严格的风险控制,因为存在较高的相关性断裂风险
- 密切监控市场状态变化
- 注意事项:
- 不建议使用EURUSD-GOLD对作为交易参考
- 需要特别关注相关性的稳定性
- 虽然趋势一致,但由于强度偏弱,建议降低交易规模
总体来看,当前市场处于一个方向一致但动能较弱的状态,主要的交易机会来自于市场间的相关性,特别是EURUSD-GBPUSD对的高相关性特征。但同时需要警惕较高的相关性断裂风险和市场状态改变风险。
6.4 增强的信号解释方法
基于实践经验和深入分析,有效解释复杂斜率信号需要建立一个多层次、动态的解释框架:
- 分层级的相关性分析体系:
- 静态相关性评估:
- 强相关市场对(>0.7):重点关注领先-滞后关系和稳定性
- 中等相关市场对(0.4-0.7):作为辅助参考,关注相关性演变趋势
- 弱相关市场对(<0.4):仅作为市场环境的背景信息
- 动态相关性监控:
- 多时间窗口滚动相关性计算(短期5分钟、中期15分钟、长期1小时)
- 相关性突变检测和预警机制
- 相关性稳定性评分系统(考虑波动率、成交量、外部因素)
- 静态相关性评估:
- 趋势一致性评估框架:
- 多维度趋势分析:
- 方向一致性:跨时间框架的趋势方向对比
- 强度评估:各时间框架的趋势强度量化
- 持续性分析:趋势的时间持续特征
- 趋势质量评估:
- 趋势得分计算(综合考虑方向、强度、持续性)
- 背离检测和预警
- 趋势转换概率评估
- 多维度趋势分析:
- 市场状态识别系统:
- 状态特征分析:
- 斜率分布特征
- 时间框架权重分布
- 波动特征分析
- 状态转换监测:
- 关键技术水平突破监控
- 市场结构变化识别
- 市场情绪指标跟踪
- 状态特征分析:
- 风险评估和监控机制:
- 相关性断裂风险监控:
- 相关系数实时跟踪
- 波动性异常检测
- 外部因素影响评估
- 成交量异常监控
- 市场状态改变风险评估:
- 趋势强度变化跟踪
- 市场结构完整性分析
- 市场情绪指标监控
- 机构持仓变化跟踪
- 相关性断裂风险监控:
- 信号可信度评分系统:
- 多因素综合评分:
- 趋势一致性得分 (0-100)
- 相关性稳定性得分 (0-100)
- 市场状态可信度得分 (0-100)
- 动态权重调整:
- 基于市场环境动态调整各因素权重
- 考虑历史准确性进行权重优化
- 引入市场波动率因子
- 多因素综合评分:
- 风险预警和应对机制:
- 多级预警系统:
- 初级预警:单一指标异常
- 中级预警:多个指标共振
- 高级预警:系统性风险信号
- 分层应对策略:
- 仓位调整方案
- 对冲策略优化
- 止损条件动态调整
- 多级预警系统:
- 信号输出优化:
- 分级信号体系:
- 核心信号:高可信度、多重确认的主要信号
- 确认信号:支持核心信号的次要信号
- 预警信号:风险提示和注意事项
- 执行建议明确化:
- 具体的操作建议
- 风险控制参数
- 信号有效期限定
- 分级信号体系:
6.5 实践建议:
- 建立系统性监控流程:
- 定期评估信号质量
- 持续优化参数设置
- 记录和分析异常案例
- 保持策略适应性:
- 根据市场状态调整策略参数
- 建立多样化的备选策略
- 保持策略切换的灵活性
- 重视风险控制:
- 实时监控风险指标
- 建立清晰的止损机制
- 保持充足的风险缓冲
- 持续优化:
- 定期回测和评估
- 收集和分析失败案例
- 更新和优化参数设置
这个增强的信号解释框架强调了系统性、动态性和风险控制的重要性,通过多层次的分析和监控机制,提供更可靠的市场洞察和交易建议。同时,框架的灵活性允许根据市场变化进行持续优化和调整,确保系统的长期有效性。
这个优化后的框架不仅提供了更清晰的信号解释结构,也更好地整合了实际市场数据的特征。在下一篇文章中,我们将详细探讨如何将这些信号转化为具体的交易决策。


